Unintended Consequences in the Creation of Index Portfolios. Tilt Strategy Drawbacks and Solutions
Read the full insight below or download the PDF version here.
Overview
Investors are often attracted to portfolio strategies known as 'factor tilts,' which intentionally focus on stocks with specific characteristics, such as low volatility, high growth, or strong momentum, in pursuit of enhanced returns or to control risk. However, the simplicity of these strategies can sometimes mask unexpected challenges.
In the article, Unintended Consequences in the Creation of Index Portfolios, we explore how straightforward factor tilting can inadvertently lead portfolios to take on hidden risks or biases. For example, focusing exclusively on low-volatility stocks might inadvertently increase sensitivity to interest rate changes. Similarly, emphasising momentum stocks could unintentionally shift the portfolio away from value-oriented companies, introducing unforeseen risks.
The article highlights several pitfalls, including the hidden complexity behind seemingly simple strategies, challenges related to timing factors correctly, implementation costs, and the diminishing returns when strategies become popular and crowded.
Finally, practical solutions are highlighted, recommending more sophisticated multi-factor strategies that balance multiple characteristics simultaneously and manage risk effectively, helping investors achieve their intended financial goals while avoiding unexpected outcomes.
Introduction: The Allure and Simplicity of Portfolio Tilting
Portfolio tilting represents a deviation from holding a standard market benchmark, such as a market-capitalisation-weighted index, to intentionally emphasise certain security characteristics. The core idea is to overweight securities possessing desirable characteristics and underweighting those lacking them. This approach has gained significant traction due to its perceived simplicity and the intuitive appeal of targeting specific return drivers or aligning portfolios with certain style biases.
Defining Simple Tilting Functions
In this context, "simple" tilting functions refer to systematic, rules-based methodologies applied to portfolio weights based on readily identifiable security characteristics. These functions often involve straightforward calculations or rankings based on single metrics or scores. Common examples include:
- Value: Overweighting stocks with low valuation metrics (e.g., price-to-book, price-to-earnings).
- Size: Overweighting smaller-capitalisation stocks relative to larger ones.
- Momentum: Overweighting stocks that have exhibited strong recent past performance.
- Growth: Overweighting stocks that show strong growth potential, as indicated by high earnings and revenue growth rates.
- Quality: Overweighting stocks displaying characteristics of financial health, such as high profitability, stable earnings, and low leverage.
- Low Volatility: Overweighting stocks with historically lower price volatility compared to the market average.
The Rationale – Why Tilt?
The motivations for employing portfolio tilting strategies generally fall into two main categories:
- Capturing Risk Premia: The primary rationale for factor tilting is grounded in financial theory and empirical evidence suggesting that certain factors represent systematic sources of risk for which investors have historically been compensated with higher expected returns over the long term. Factors like Value, Size, Quality, Momentum, and Low Volatility are often referred to as sources of "risk premia." Simple tilting strategies are often presented as a transparent and cost-effective way to "harvest" these potential excess returns by systematically increasing exposure to these factors relative to a market-cap benchmark.
- Implementing Investment Views or Mandates: Tilting provides a mechanism for investors to express specific market views (e.g., a belief that small-cap stocks will outperform) or, more commonly in recent years, to align portfolios with specific non-financial mandates or values. ESG tilting is the most prominent example, allowing investors to overweight companies perceived as more sustainable or responsible, or underweight those involved in controversial activities. We will not be covering ESG strategies in this paper.
So, What’s the Issue?
The appeal of simple tilting strategies lies in their apparent straightforwardness and rules-based nature. However, this simplicity often masks significant underlying complexities, risks, and limitations. We argue that a critical examination is necessary, as the seemingly easy path of simple tilting can lead investors into unforeseen pitfalls, potentially resulting in unexpected risk exposures and outcomes that fail to meet either financial or non-financial objectives. The following sections delve into the specific drawbacks associated with simple factor tilting and we offer an alternative approach designed to mitigate the prominent pitfalls.
Hidden Complexities: Pitfalls of Simple Factor Tilting
While simple factor tilts offer an intuitive way to gain exposure to potential risk premia, their simplicity is often their primary weakness. Naive approaches based on single factors or simplistic metrics can overlook crucial market dynamics and implementation realities, leading to a range of potential pitfalls.
Oversimplification Risk
Simple, single-factor tilts inherently ignore the complex, multi-dimensional nature of financial markets. Asset returns are rarely driven by just one characteristic in isolation. Factors interact, and their correlations can change over time. A stock might appear attractive based on a simple value metric (e.g., a low price-to-earnings ratio) but simultaneously exhibit poor quality characteristics (high leverage, low profitability) or negative momentum (poor recent performance), which also have documented relationships with future returns. Relying solely on one dimension provides an incomplete picture and can lead to suboptimal security selection.
Furthermore, the metrics used in simple tilt strategies can be overly simplistic representations of the intended economic concept. For example, using only the book-to-price ratio for a value tilt might misclassify companies, especially in an economy where intangible assets (poorly captured in book value) are increasingly important. More sophisticated approaches often use composite scores or multiple metrics to define a factor more robustly. The very simplicity that makes these single-factor tilts easy to understand and implement becomes a source of risk, as it neglects essential context and the interplay between different return drivers that more advanced multi-factor models attempt to capture and balance.
Unintended Consequences: Hidden Bets and Biases
A significant drawback of simple factor tilting is the introduction of unintended exposures to other factors, sectors, industries, or macroeconomic risks. Tilting a portfolio towards one desired characteristic often implicitly tilts it towards or away from others due to correlations between factor exposures.
For instance, a Low-Volatility tilt frequently leads to an overweight in the Utilities and Consumer Staples sectors, making the portfolio potentially more sensitive to changes in interest rates than the broader market. Similarly, a simple Value tilt might result in an unintended negative exposure to the Quality or Momentum factors, as value stocks can sometimes be companies with weaker fundamentals or poor recent performance. These "hidden bets" can significantly influence the portfolio's overall risk and return profile, sometimes dominating the effect of the intended factor tilt. Investors might find their portfolio performance driven by exposures they did not consciously choose to take and for which they may not be compensated, and hence resulting in unrewarded risk taking. This lack of integrated risk control is a key limitation of simplistic approaches compared to more sophisticated optimised multi-factor strategies that can explicitly manage such unintended exposures.

Unintended Consequences: An Example
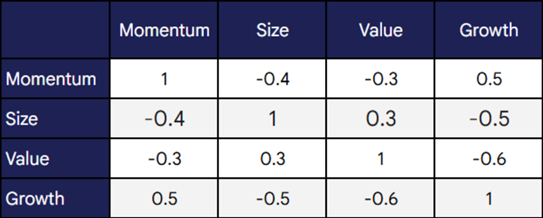
To illustrate how correlated style exposures can lead to unintended outcomes under simple tilt-based portfolio construction, we rely on the correlation matrix shown below for Momentum, Size, Value, and Growth. In Table 1, notice that certain pairs of factors (e.g., Momentum and Growth) are positively correlated, while others (Size and Growth) show a strong negative relationship. This framework highlights how a tilt in one factor can indirectly—but meaningfully—alter exposures to others.

Table 1. Style Exposure Correlation Matrix
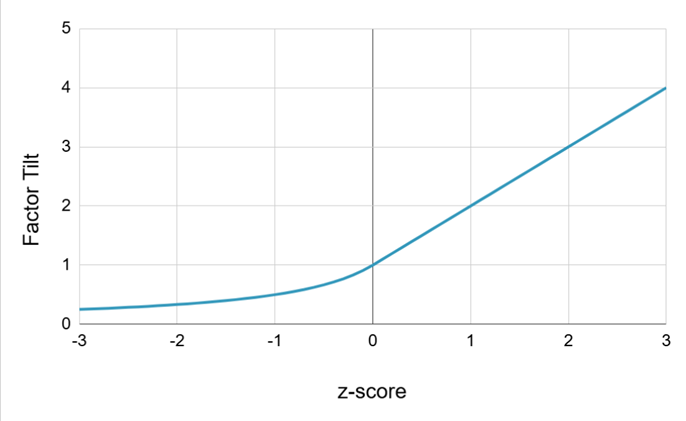
To construct the tilt portfolio we use the tilt function shown in Chart 1. This tilt function converts standardised scores into portfolio weights by multiplying benchmark weights by the value of the factor tilt.

Chart 1. Portfolio Tilt Function
In this example we will construct a Momentum based tilted portfolio. Positive z-scores mean that a stock’s Momentum is above average, negative z-scores mean they are below average. If a stock’s Momentum score is positive (meaning it’s above average), then the tilt function over weights the stock relative to the benchmark weight. If the score is below zero, the tilt function decreases the stock’s weight using an inverse adjustment. Although this rule might appear simple at first, the fact that Momentum is often linked to other stock characteristics means these adjustments can interact in unexpected ways.
The simulation below shows how these combined effects can lead to significant changes in the overall style of a portfolio, highlighting the importance of understanding these interactions even when applying straightforward tilting methods.
To build the Momentum-tilted portfolio, we take a two-step approach. First, for each stock in the benchmark portfolio we generate standardised scores that reflect each stock’s exposure to each of the different style factors (Momentum, Size, Value, and Growth). Then, we adjust these scores using the style exposure correlation matrix that shows how these style exposures are related, giving us a more realistic set of scores for each stock. Next, we take each stock’s Momentum score, process it through the tilt function, and then apply the resulting adjustment factor to its benchmark weight to form the Momentum-tilted portfolio.
Table 2 below shows the results and includes the weight of each asset in the benchmark portfolio, Momentum scores, Momentum tilt portfolio weights, and active weights of the tilt portfolio (ie, Momentum tilt weights minus benchmark weights).

Table 2. Tilted Portfolio Results
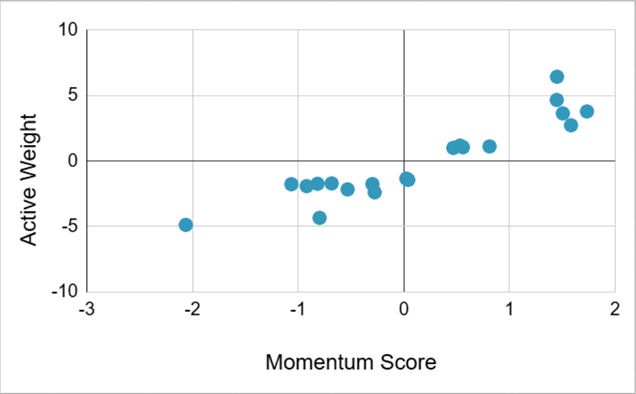
In Chart 2 we show a scatter plot that pairs up the Momentum scores with the resulting tilt portfolio active weights. Positive Momentum scores result in overweight positions, and negative Momentum scores result in underweight positions.

Chart 2. Active Weights vs Momentum Scores
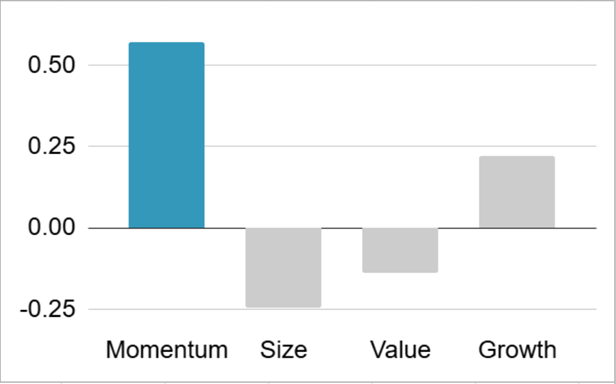
Now that we have created the Momentum tilt portfolio, what can we say about any unintended consequences of using this portfolio construction approach? Beyond the intended Momentum bias, we can examine what other style factor exposures result from the tilting process, potentially leading to amplified or diminished influences that may alter the portfolio’s overall risk and return characteristics. Chart 3 shows the average active style exposures for the portfolio.

Chart 3. Tilt Portfolio - Average Active Style Exposures
The analysis reveals that the portfolio exhibits a strong, positive exposure to Momentum, as we would expect given the portfolio construction process focusses on this. In addition, we observe varied, non-zero exposures to the other style factors. Although these additional exposures are not as pronounced as the Momentum exposure, their uncontrolled nature can still contribute significantly to the portfolio’s active risk and potentially undermine its returns—essentially, leading to unrewarded risk-taking.
The Timing Trap: Factor Variation and Static Exposures
Factor returns are not constant; they change through time and can experience prolonged periods of underperformance relative to the market or other factors. The Value factor, for example, has endured multi-year stretches of lagging growth stocks. Momentum strategies are known for long periods of good performance and also suffer from large, occasional, sharp crashes.
Chart 4 shows the cumulative performance of several of the Fama-French style factor returns and the broad Asia Pacific ex-Japan Index from the end of 2014 to the start of 2025.

Chart 4. Fama-French Factor Returns and Market Return (Cumulative)
Momentum performance dominated the other styles over this period. Note that the Size factor returns shown in the charts are the reversed version of the Fama-French Small Minus Big (SMB) factor. This transformation was applied to better align the results with standard Size factor definitions used by providers such as MSCIBarra.
It is instructive to look at the performance of the style returns relative to the market return - this will help show how unintended exposures can impact portfolio performance. Note that we have removed the Momentum factor line as it clearly outperforms the market return.

Chart 5. Fama-French Factor Returns Relative to the Market Return (Cumulative)
Simple tilting strategies typically maintain a fixed overweight or underweight stance on a factor, regardless of changes in the market environment, valuation, or recent performance trends. This static approach makes them particularly vulnerable to adverse shifts—if a Momentum-tilted portfolio unintentionally carries a bias away from the Value factor, for example, it will suffer when value stocks outperform because there’s no mechanism to adjust the exposure.
Chart 5 displays the returns of the Size and Value factors relative to the overall market. A return above the zero line indicates that the factor is outperforming the market, while a return below the zero line indicates underperformance. Focusing on the Value factor (represented by the purple line) and recalling that Chart 3 showed an underweight exposure to Value, consider the following observations:
• Before 2020: The Value factor outperformed the broad market, so the unintended underweight position in Value would have detracted from the strong performance expected from the overweight Momentum exposure.
• During 2020: The Value factor underperformed the broad market, as shown by the significant drop in relative performance. In this scenario, the underweight position would have boosted the performance of the Momentum-tilted portfolio.
• In 2021: The earlier gains were reversed when the Value factor’s performance rebounded, effectively cancelling the benefits realised in 2020.
Ultimately, this unintended active exposure to Value increases the volatility of the portfolio’s returns without providing a commensurate reward—highlighting a key drawback of static tilting strategies.
While the obvious solution might seem to be dynamic factor timing – adjusting factor tilts based on predictive signals – extensive research suggests this is exceptionally difficult to execute successfully in practice. Signals based on valuation, momentum, or economic regimes often lack consistent predictive power after accounting for implementation costs and the risk of model overfitting. The documented failure of many sophisticated timing models serves to underscore the significant risk embedded in purely static, simple tilts. If actively timing factors is challenging, a static approach offers no defense against inevitable factor cycles, challenging the notion that factor premia can be easily and consistently harvested through simple means.
Implementation Hurdles: Costs, Turnover, and Capacity
The theoretical excess returns suggested by academic factor research often neglect real-world implementation frictions, which can significantly erode actual performance.
- Transaction Costs and Turnover: Rebalancing a tilted portfolio incurs transaction costs, including brokerage commissions, bid-ask spreads, and potentially significant market impact costs, especially when trading large volumes or less liquid securities. High-turnover factors like momentum are particularly susceptible to cost erosion. Simple tilts involving small-cap stocks also face higher trading costs due to lower liquidity. Market impact, where the act of trading moves prices unfavorably, becomes more pronounced as strategies attract more assets.
- Capacity Constraints: Factor strategies are not infinitely scalable. As assets under management grow, it becomes harder to trade the required volumes without adversely affecting prices (market impact) or finding enough securities with the desired factor characteristics. Capacity constraints can diminish or even eliminate the factor premium for large investors. Momentum and strategies focused on smaller stocks are often cited as having lower investable capacity.
These implementation realities mean that the net returns achieved by investors employing simple tilting strategies can be substantially lower than the gross returns suggested by backtests or theoretical models.
Data-Driven Dangers: Mining, Overfitting, and History
The proliferation of factors, often termed the "factor zoo," raises concerns about data mining or data snooping. With vast amounts of financial data and powerful computing resources, it's possible to find factors that appear to have worked historically purely by chance or through overfitting the data, rather than reflecting a genuine investment rationale. Simple tilting strategies, being easy to backtest across numerous variations, are particularly vulnerable to being based on such spurious findings.
Investment strategies are often introduced or promoted based on impressive backtested performance. However, these backtests can suffer from selection bias—only the successful tests tend to be shown, a practice sometimes described as “torturing the data until it confesses”—and they often fail to deliver similar results in live, out-of-sample situations. For example, a simple tilt strategy might be adopted because a factor showed strong historical performance, even though it hasn’t been rigorously tested across different time periods or markets, or backed by a sound investment rationale. Consequently, such strategies are likely to disappoint in the future when the specific historical conditions that led to the backtested success do not recur.
The Crowding Effect: Factor Decay
As specific factor tilts gain popularity and attract significant capital through ETFs and other investment products, their effectiveness may decrease over time. This decline, known as factor decay or crowding, happens when investors collectively drive up the prices of stocks with attractive factor characteristics while selling those with less desirable traits. As a result, the valuation differences that underpin factors like value shrink, limiting the potential for future excess returns. This behavior illustrates the Efficient Market Hypothesis in action—exploitable opportunities are temporary and eventually disappear.
Excessive investor concentration can heighten the risk of factor crashes. In such situations, abrupt changes in market sentiment or liquidity can force a large number of investors to exit similar positions all at once, triggering significant losses for that factor. Although there is debate about how crowded these popular factors currently are, the risk persists. A simple tilting strategy based solely on a factor’s historical performance—without accounting for its current level of crowding or valuation—may leave investors vulnerable to the possibility that the anticipated factor premium has already been largely eroded or arbitraged away.

Table 3: Key Pitfalls of Simple Factor Tilting

Beyond Simplicity: A Glimpse at Sophisticated Alternatives
Recognising the shortcomings of simple tilting strategies has led to the development of more advanced approaches to factor investing. These modern methods overcome the limitations of basic techniques by integrating a broader range of data, actively managing risks, and employing more refined portfolio construction techniques.
Addressing Factor Tilting Pitfalls
To overcome the drawbacks of simple single-factor tilts, several more detailed methodologies are available:
- Multi-Factor Integration: Rather than focusing on a single factor, these strategies combine multiple factors—such as Value, Momentum, Quality, Size, and Low Volatility—within one portfolio. This diversification helps smooth performance over different market cycles, as each factor tends to perform differently at various times. Construction approaches vary from a top-down method, where single-factor portfolios are combined, to a bottom-up strategy that selects stocks based on overall multi-factor scores. Additionally, optimisation techniques are often used to fine-tune the portfolio weights, balancing factor exposures while controlling for unintended risks and tracking error relative to a benchmark.
- Dynamic Factor Timing: Recognising that factor returns can fluctuate over time, dynamic timing strategies attempt to adjust exposures based on various market signals. These signals may include macroeconomic indicators (reflecting the prevailing economic conditions), valuation metrics (indicating whether a factor appears attractive relative to historical averages), or performance trends. However, as previously noted, consistently successful factor timing remains elusive, with many studies showing limited out-of-sample benefits once costs are considered.
- Risk-Managed Approaches: These strategies prioritise risk management in building a portfolio. For example, Risk Parity seeks to balance the risk each asset or factor contributes instead of allocating capital solely based on dollar amounts. This approach ensures that no single source of risk dominates the portfolio. Other methods focus on reducing unintended exposures that may arise from factor tilts or directly managing overall portfolio volatility.
Conclusion: Tilting with Eyes Wide Open
Portfolio tilting offers a straightforward way to deviate from standard benchmarks in pursuit of higher returns or alignment with specific investment views. However, our analysis shows that this apparent simplicity can hide significant risks.
Simple factor tilting strategies aim to capture risk premia, but by oversimplifying complex market dynamics, they can result in unexpected exposures to certain factors or sectors. These unintended exposures may dominate overall portfolio risk and returns, especially since static strategies are slow to adjust when market conditions shift. Moreover, the attractive performance seen in backtests is often reduced in practice by real-world implementation costs, limits to scalability, and the risk of relying on factors that succeeded only due to historical quirks rather than sound economic reasons. The risk of factor decay from crowding further challenges the long-term viability of such simple approaches.
Investors should not be seduced solely by simplicity and past success. It is crucial to fully understand the underlying methodology, hidden biases, and potential costs before embracing any tilting strategy.
Ultimately, whether portfolio tilting is appropriate depends on an investor’s specific objectives, risk tolerance, time horizon, and willingness to conduct detailed due diligence. While simple tilts can be a useful tool, they are not a guaranteed path to superior returns and come with hidden risks that require careful consideration.
About RoZetta Technology
Addressing the entire data lifecycle, RoZetta Technology’s cloud-based DataHex platform enables financial institutions to improve data standardisation and interoperability, manage data costs effectively, and simplify vendor transitions.
Building upon this foundation, RoZetta provides significant added value through advanced data analytics tools for actionable insights and a framework for the efficient creation of sophisticated investment products. Leveraging a cloud-native architecture provides a transparent and flexible data market, enabling institutions to optimise their data, reduce costs, enhance operations, and unlock new opportunities for growth and innovation.

Paul Spence
Chief Data Scientist, RoZetta Technology
Email: paul.spence@rozettatechnology.com
LinkedIn: Connect with Paul Spence
Partner with RoZetta Technology to drive innovation in your financial product offerings. From indices and ETFs to bespoke solutions, we provide the expertise to help you succeed. Contact us at enquiries@rozettatechnology.com or Visit rozettatechnology.com